Not all crimes are equal
Volume share by primary category
bar · 34 categories
Top 10
Long tail
Across Chicago's 77 community areas, the 2001-to-April-2026 police record is too big to read line by line. Crimiviz turns it into a focus-mode map, four trend charts, and three editorial deep-dives.
Each of Chicago's 77 community areas is shaded by total reported volume, click and zoom into any one to see every individual incident on file. Press play on the years or the hours to sweep through time, or set any combination of filters yourself
Four lenses on the same eight and a half million rows, by month, by hour, by category, by outcome.
Regarding the amount of crimes per month, february is by far the least. This, not only, can be explained by the cold weather and people staying more at home. It is combined with the fact that February only has 28 days, meaning 2 or 3 less days than all the other months. The dropdown during this month is a regular phenomenon observed in criminology. Concerning arrest rates, we can categorise crime into 2 different types: High-Volume/Low-Arrest which are driven by reactive policing (citizens have to report them) and Low-Volume/High-Arrest which are driven by proactive policing (police reports the crime because criminal is caught red handed). So it is without surprise that we observe Prostitution or Narcotics at the top of the list, while Burglary or Criminal Damage is at the bottom, due to the very nature of these crimes being way harder to catch.
Each one starts from the same 8.5 million rows. Pick a card to read it.
The year holds two stories. A six-week stay-at-home trough through spring, then a three-day spike of unrest at the end of May.
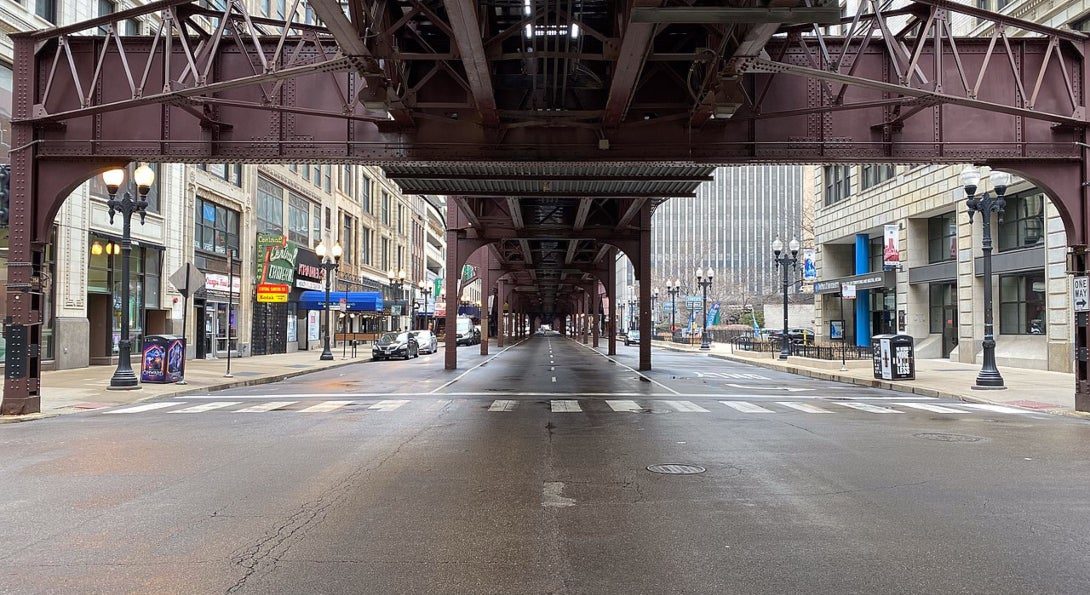
On March 21, 2020, Illinois ordered residents to stay at home because of the COVID pandemic. Within a week, Chicago's daily count of reported incidents had fallen below anything the same calendar week showed in 2018 or 2019. Across the six weeks of the order the city averaged — incidents a day, against — a day for the matching window the two years before. A drop of —.
The mechanism is the same one that runs through the blizzards card. Routine activity needs people in the street: bus stops, parking lots, sidewalks, bars. Pull them indoors and most of what the city counts as crime stops happening. Narcotics enforcement collapses hardest because it depends almost entirely on stops in public places. Theft, burglary, and criminal damage drop too, by smaller fractions.
The chart below shows the whole year in one view. The dark fill across April and May is the lockdown trough. The drop of volume stayed even after the lockdown ended except for the red column rising out of it at the end of May. It is a different story, hidden inside the same year. Press play to look closer.
2020 daily incidents against the 2018-19 same-day baseline. Dark fill below the dashed line is the lockdown trough; red above is the late-May spike. Press the play button to zoom into the peak day.
May 25 → June 5, 2020. A brief surge in burglary, criminal damage and weapons charges sits inside the six weeks of lockdown.
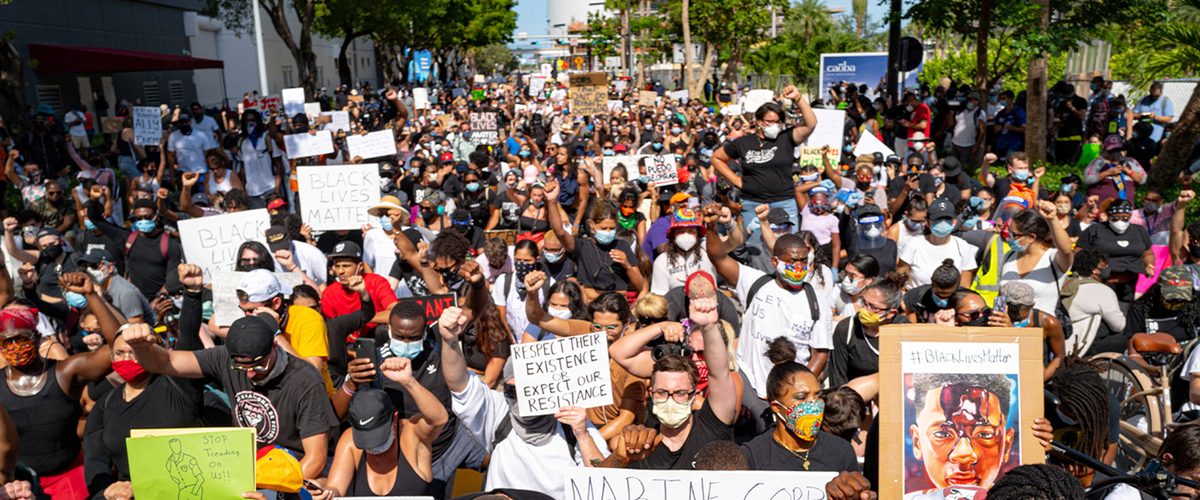
George Floyd was killed by police in Minneapolis on May 25, 2020. Protests started there and reached every major American city within a week. Chicago's downtown marches escalated on the evening of May 30, and the city raised its bridges over the river. By the end of May 31 the daily incident count had reached ·, the highest single-day total of the year and about · above the surrounding two-week baseline. A 9 pm city-wide curfew began the next day. By June 3 the line was back inside the lockdown trough.
Tens of thousands of people marched in Chicago and across the country in the days after George Floyd's death. Those protests were lawful and peaceful. The chart shows a coincident rise in specific kinds of crime (burglary, criminal damage, weapons violations) during the same period of unrest. That is a correlation in time, not proof that the protests caused the crime. Some might come from the protests but many comes from people who took advantage of the situation.
The chart above held the spike against a year of mostly empty streets. The chart below shows what was inside the spike. Burglary jumps from a typical 264 per week to 1,069 in eight days, the largest move on the page. Criminal damage rises about 70%, from roughly 655 to 1,115. Weapons violations and public peace offences climb sharply too, from small bases. Everyday street crime, theft and narcotics, falls hard across the same days.
8-day Floyd window (May 29 → Jun 5) against the 2018-19 same-window mean. Property and order categories climb while everyday street crime drops.
We go back to the year 2020 bigger picture. Each crime category has its own shape across 2020. Some take more the pattern of lockdown and some peak more during the Floyd window.
Weekly counts, eight robust categories only (lockdown-window baseline ≥ ~180 per week). 2020 line over the faint 2018-19 baseline. Hover any panel for that week's count vs baseline. Toggle the y-axis: shared (magnitudes comparable) or per-panel (each shape fills its frame).
The year ran two stories at once. The dominant one was structural: a six-week drop when the city's routine activity stopped. The brief one was reactive: a three-day spike of property crime and disorder when the streets filled again, this time for unrest.
Crime in this dataset is mostly what happens when people are out. Empty the streets and the count falls. Fill them with something other than ordinary life and the count rises.
Across the mid-2010s, the monthly volume of reported incidents in Chicago was stable. On the other side, for the arrest rate, it is a different story.
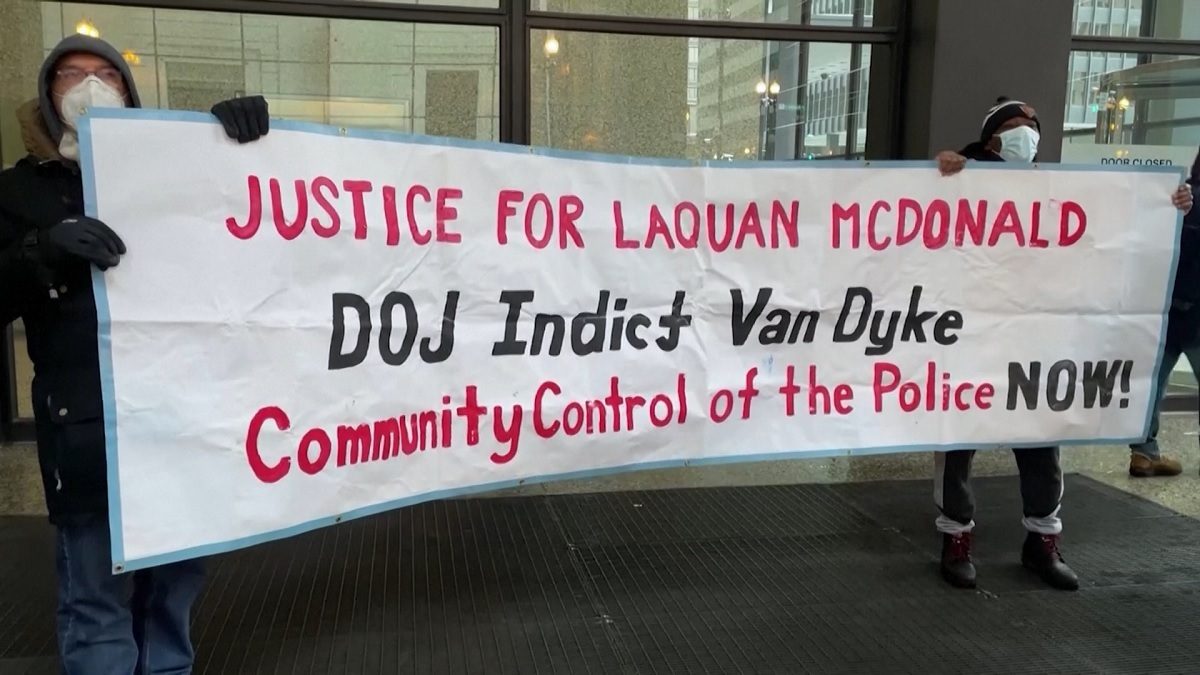
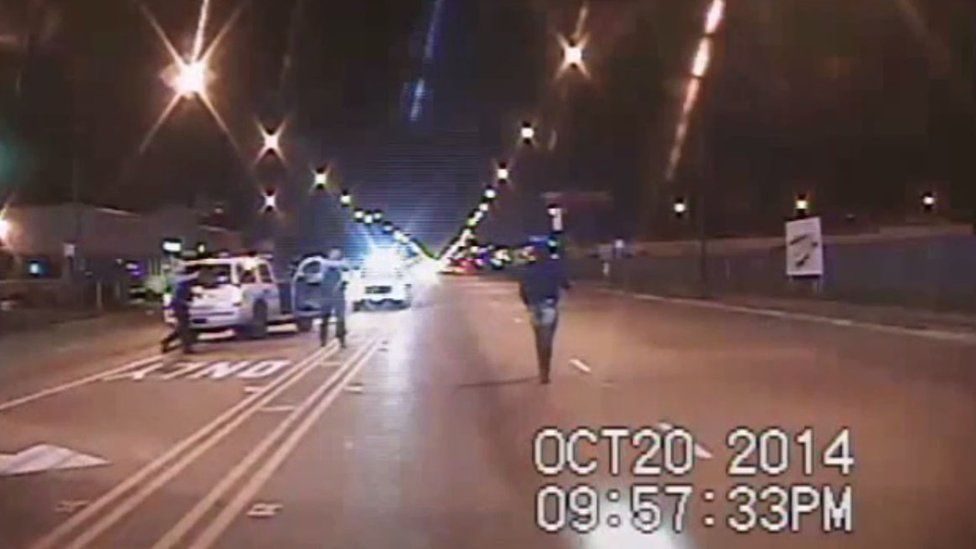
On the night of October 20, 2014, an officer named Jason Van Dyke fired 16 rounds at 17-year-old Laquan McDonald on South Pulaski Road. A dashcam in a nearby cruiser recorded the whole thing. For 13 months the city kept the file out of public view.
A freelance journalist named Brandon Smith spent most of 2015 trying to find and release publicly the video, first under the Illinois Freedom of Information Act and then through Cook County court. The city's lawyers fought him at every step, arguing that release would prejudice an open investigation. On November 19, 2015, Judge Franklin Valderrama ordered the city to produce the video within five days. Hours before that deadline expired on November 24, the Cook County State's Attorney charged Van Dyke with first-degree murder. The video went out the same evening and the case became a national controversy.
The release detonated a week of demonstrations. Crowds shut down Michigan Avenue on Black Friday and returned downtown through most of December. Mayor Rahm Emanuel asked for and accepted the resignation of Superintendent Garry McCarthy on December 1. Within days, the head of the city's police-oversight body had also stepped aside; the Cook County State's Attorney was facing public calls to do the same. For a stretch of weeks, the city operated in open political crisis.
The case was a scandal and the city went through a year of political fire over it. The question is whether anything changed in how the Chicago Police Department does its job.
Crime volume holds its range but the arrest rate breaks. Hover (or tap) the chart to read any month.
Yes, and sharply. The crime did not change. Across the 48 months centred on November 2015, the monthly volume of reported incidents drifts by only ·. The response did. In the 24 months before the marker, roughly · of incidents ended in an arrest. In the 24 months after, ·. A gap of · opened in about a year, and the line settled into a new groove well below the old one. Same incidents. Different department.
Why the response changed is harder to say. The most-discussed explanation is de-policing, sometimes called the "Ferguson effect". It is the idea that after high-profile cases of police violence and the scrutiny that follows, officers pull back from proactive stops and arrests, whether to avoid risk or in response to lower morale. The mechanism is plausible, but it is hard to prove: a drop in arrests is consistent with de-policing, but also with other changes happening at the same time. One of those is concrete. In August 2015, the Chicago Police Department signed an agreement with the ACLU that required officers to file a detailed report for every investigative street stop. That added paperwork, and it changed how stops were recorded.
The break was not a single shock. It was a cascade that ran for years, through City Hall, the police department, and the federal government.
Each event below is dated from the public record.
The case did not end there. The DOJ probe opened on December 7 became, by January 2017, a 164-page report finding a pattern of excessive force and constitutional violations by the Chicago Police Department. When the incoming Trump administration declined to pursue reforms, Illinois Attorney General Lisa Madigan sued the city in August 2017 to force them anyway. That suit produced a settlement and, on January 31, 2019, a federal consent decree.
Scandals fade. The next question is whether this one did. Was the break a brief reaction or did the new level hold?
The arrest rate falls to a new level and stays there.
It held. A decade on, the line has not climbed back. The arrest rate fell off a cliff in late 2015 and stayed down.
It is tempting to read the decree onto this picture: the reform that kept the new level in place. The dates make that hard. The drop began in late 2015. The decree was entered in January 2019, more than three years later. Whatever cemented the change was cemented before the decree existed. Reading any post-2019 decree effect is harder still: the pandemic arrives in 2020 and disrupts every series in Chicago's records for the years that follow. What the timing on this chart points to is the case itself (the moment something visible happened inside the department), not the legal mechanism that arrived years later. That is not a verdict on whether the decree worked. It is a reading of when the line moved.
The data on this page fixes the when, sharply. The why is contested, and this article does not try to settle it. Any of these threads from the case itself, de-policing, the stop-report paperwork, federal scrutiny can be pulled.
Three of the harshest winter events in a quarter-century of Chicago's incident records. Two were polar vortices. One was a blizzard. How does crime react to it ?
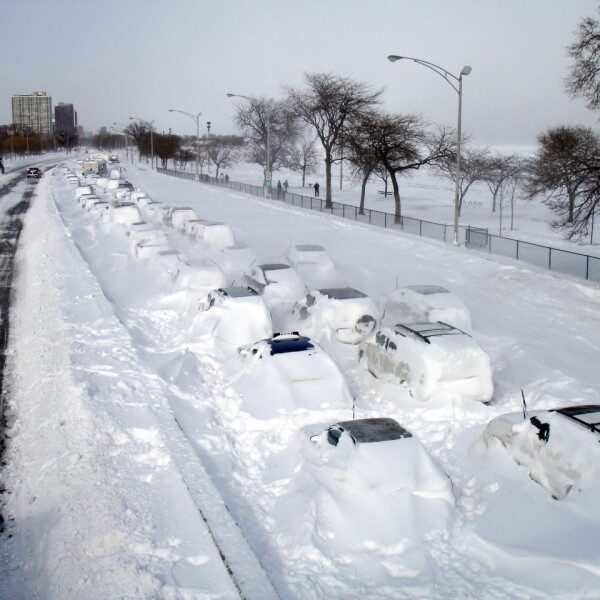
On February 2, 2011, 21 inches of snow fell on Chicago. Drifts buried Lake Shore Drive and the city stopped. That day, the police logged 320 incidents, less than a third of the usual daily average.
The same drop showed up in January 2014, when O'Hare hit -23 degrees for three straight mornings, and in January 2019, when the polar vortex pushed wind chills below −30°. Three winters, three mayors, three police chiefs. Each time the streets went quiet and the count fell.
The chart below puts all three side by side. It's the first thing to say about Chicago and extreme winter.
Each row is one event. The connector shows the distance from the surrounding-week baseline to the quietest day inside the event.
Cohen and Felson's 1979 routine activity theory of crime asks for three things to be in the same place at the same time: a motivated offender, a suitable target, and the absence of anyone who could intervene. The streets are where they meet and most of what the city counts as crime starts there.
All of that requires people in the street and extreme winter empties those streets. That can happen because of cold (2014, 2019) or because of snow (2011). The calendar in the margin shows that February 2011 wasn't especially cold for a Chicago winter. It was, however, impassable, and crime fell harder than in either polar vortex.
The chart below traces each event day by day, with temperature on one axis and the daily count on the other. Pick an event and press play: the dot walks through the dates in order, and the days of the event itself fall to the lowest points on the line so the coldest, emptiest days are also the quietest for crime. But notice the path is not a clean slope. The trajectory through time with warmer and colder days don't line up exactly with more or less crime.
One event at a time, traced from a week before each event through two weeks after. Honest axes; the path follows the dates, not a fit. Hover any revealed day for that day's temperature and incidents vs. baseline. (The 2011 panel is the snow event; its temperatures are unremarkable.)
Not every kind of crime drops by the same amount. The outdoor categories fall hardest: narcotics deals, theft, the stops that turn into other charges. Battery and assault, which often happen between people who already live together or stay indoors together drops less.
The chart below covers the six primary categories with enough yearly volume to read on a two-day window. The thirty-odd niche categories below that threshold swing too much from year to year for a reliable read, so we leave them off.
Six robust categories only (baseline ≥ ~100 per year). Each bar is the average drop vs. adjacent-year baseline across the three events.
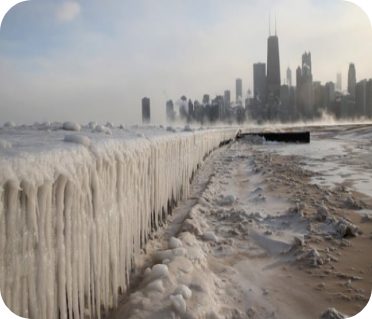
What about afterwards? Does the count snap back when the city reopens? Does it overshoot, as people make up for the days they lost? Or does it just rejoin the seasonal floor?
The trough is short in all three events. Within a few days each line is back within 10% of its baseline. After that, the answers diverge. The 2011 and 2014 series settle quietly along the dashed baseline for the rest of the window. The 2019 series climbs back through the baseline and stays above it for 10 straight days, running 10% to 40% ahead. But one overshoot out of three is not a pattern.
Each panel runs from a week before each event through two weeks after, against the same-calendar-day mean of the year before and the year after.
Crime in the dataset is mostly opportunity. Opportunity needs contact, and contact needs people outside. Take the outside away and the count falls. Take it away in three different winters across two decades and it falls the same way each time.
Nothing the police department or the courts have tried in 25 years produces a drop on the scale of what 21 inches of snow or a −30° wind chill does in 48 hours. For 48 hours, the weather does what no police department could.